Profiling the code
Overview
Teaching: 10 min
Exercises: 0 minQuestions
How to get the computed time for a chunk of code?
How to profile the R code
Objectives
Learn system.time() function
Learn Rprof() function
Function Dates of system
today_date <- Sys.Date()
print(today_date)
date1 <- as.Date("2017-12-02")
print(date1)
#different between date
print(today_date-date1)

time_now <- Sys.time()
print(time_now)
Computation time for a chunk of code
- Examine how much time is spent in programming’s parts.
- Useful for optimization your code with parallel computation
system.time(runif(300^3)*3)
system.time(Sys.sleep(20))
user: time charged to the CPU for this expr elapsed: “wall clock” time
Profiler
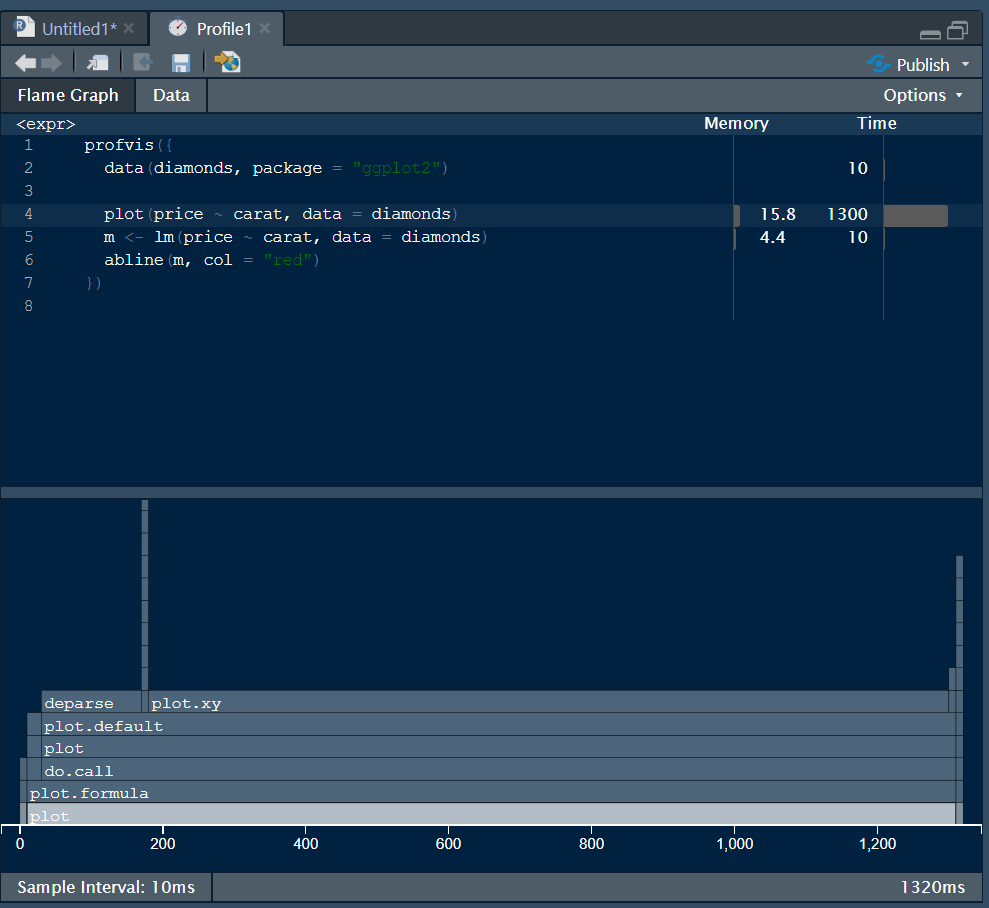
system.time()allows to test certain functions or code blocks.- The profiler is a tool for helping you to understand how R spends its time. It provides a interactive graphical interface for visualizing data from Rprof, R’s built-in tool for collecting profiling data and, profvis, a tool for visualizing profiles from R. In this document, we’ll understand how to profile code using the profiler and walk through a couple examples to help diagnose and fix performance problems.
- Here’s an example of the profiler in use. We’ll create a scatter plot of the diamonds data set, which has about 54,000 rows, fit a linear model, and draw a line for the model. If you copy and paste this code into your R console, it’ll open the same profiler interface that you see in this document.
Using profvis() tool
#You need to install profvis, ggplot2 if not installed
library(profvis)
profvis({
  data(diamonds, package = "ggplot2")

  plot(price ~ carat, data = diamonds)
  m <- lm(price ~ carat, data = diamonds)
  abline(m, col = "red")
})
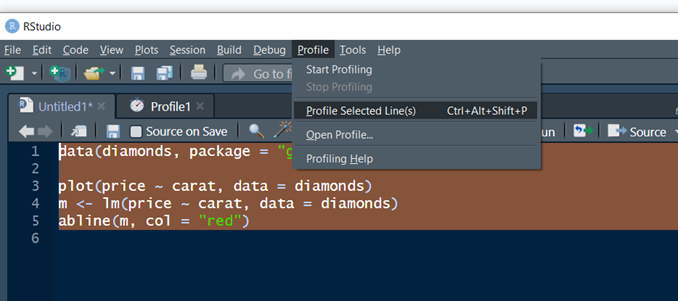
Alternatively user can select the chunk of code and Select Profile\Profile Selected Line(s)
Using Rprof()
Rprof() # Turn on the profiler
data(diamonds, package = "ggplot2")

plot(price ~ carat, data = diamonds)
m <- lm(price ~ carat, data = diamonds)
abline(m, col = "red")
Rprof(NULL) # Turn off the profiler
summaryRprof()
Key Points
system.time()
Rprof()