Basic Plotting system
Overview
Teaching: 5 min
Exercises: 0 minQuestions
How many plotting system in Python
How to use Matplotlib & Seaborn
Objectives
Basic Matplotlib
Basic Seaborn
Plotting system in Python
There are many different packages providing plotting system for Python.
- The oldest one is Matplotlib, introduced in 2003 and gives you more control over your plots
- Seaborn is an abstraction layer on top of Matplotlib; You can write a shorter code but having a nicer plot than Matplotlib. Seaborn can be compared to ggplot2 in R.
- Other: Plotly, Bokeh, Altair, Pygal and their discussion can be found here
How to display plot in Jupyter Notebook
You can visualize plot in JNotebook using %matplotlib notebook and %matplotlib inline magic commands.
%matplotlib notebook
(%matplotlib inline)

import matplotlib.pyplot as plt
plt.plot(1,2,'*')

More control over plot using Matplotlib
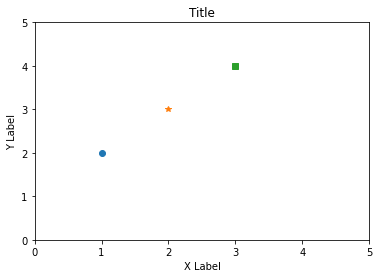
# Design the plot
plt.figure()

# Start plotting
plt.plot(1,2,'o')
plt.plot(2,3,'*')
plt.plot(3,4,"s")

# Label and Title:
plt.xlabel('X Label')
plt.ylabel('Y Label')
plt.title('Title')

# Get current axes
ax = plt.gca()
#Set axis property to range (0, 5)
ax.axis([0,5,0,5]))
Subplot in Matplotlib
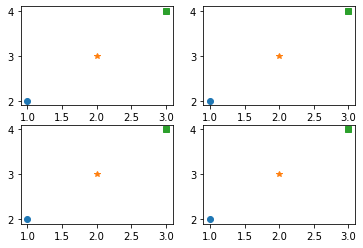
Very similar to Matlab, one just need to insert the plot number using subplot command:
plt.subplot(2,2,1)
plt.plot(1,2,'o')
plt.plot(2,3,'*')
plt.plot(3,4,"s")

plt.subplot(2,2,2)
plt.plot(1,2,'o')
plt.plot(2,3,'*')
plt.plot(3,4,"s")

plt.subplot(2,2,3)
plt.plot(1,2,'o')
plt.plot(2,3,'*')
plt.plot(3,4,"s")

plt.subplot(2,2,4)
plt.plot(1,2,'o')
plt.plot(2,3,'*')
plt.plot(3,4,"s")
Install and import seaborn
!pip install seaborn
import seaborn as sns
Key Points
Use Jupyter Notebook as general platform to write and visualize Python code using Matplotlib and Seaborn