Box plots and Violin plots
Overview
Teaching: 20 min
Exercises: 0 minQuestions
What is box plot
Objectives
How to draw a nice box plot
Boxplot
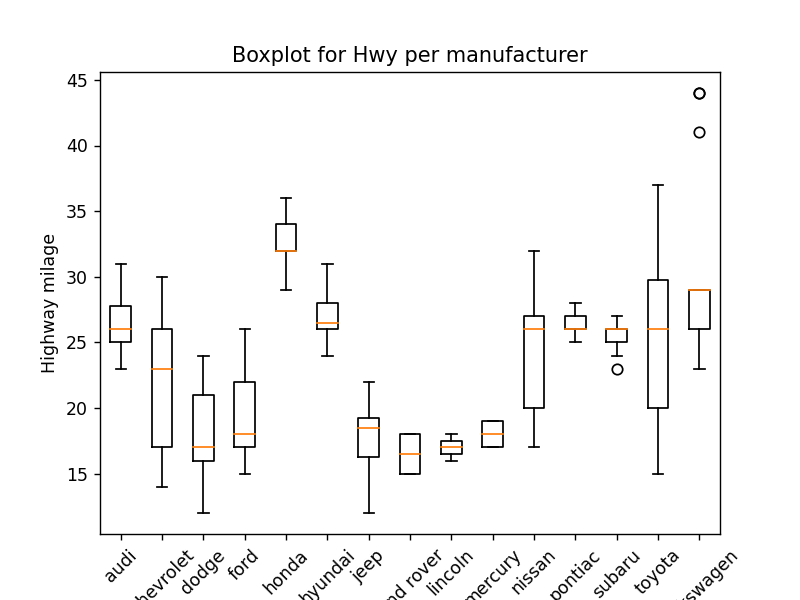
Here I am plotting the boxplot of highway (hwy) fuel consumption (mpg) for each manufacturer. It is more work using Matplotlib compared to Seaborn for this type of plot:
Using Matplotlib
%matplotlib notebook
data = []
F = df.index.factorize()
for manu in F[1]:
    data.append(df[df.index==manu]["hwy"])

fig, ax = plt.subplots()

ax.boxplot(data)
ax.set_xticklabels(F[1],rotation=45)

plt.title("Boxplot for Hwy per manufacturer")
plt.xlabel('Manufacturer')
plt.ylabel('Highway milage')
Using Seaborn
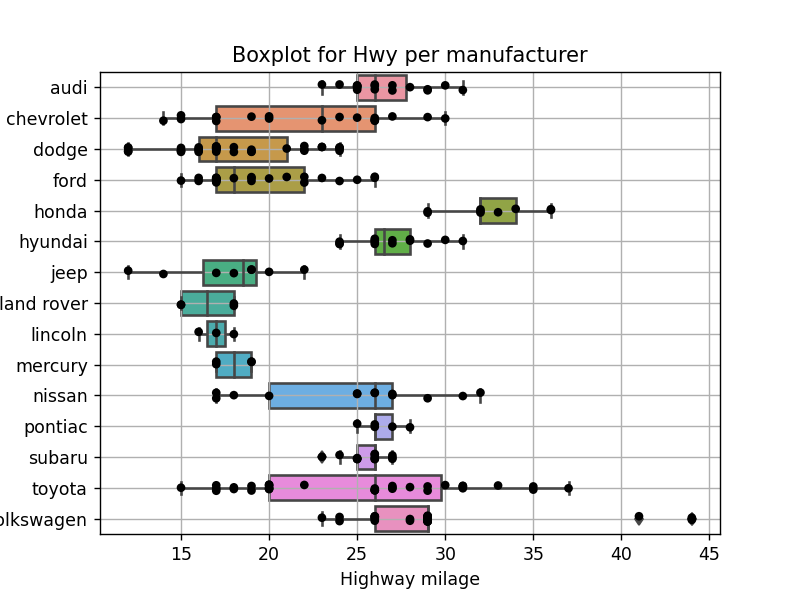
For this type of plot, Seaborn provides better and faster method of plotting:
%matplotlib notebook
import seaborn as sns
ax = sns.boxplot(x="hwy",y="manufacturer",data=df)
ax = sns.stripplot(x="hwy",y="manufacturer",data=df,color="black")
ax.set(ylabel='Manufacturer',
       xlabel='Highway milage',
       title='Boxplot for Hwy per manufacturer')
ax.grid()
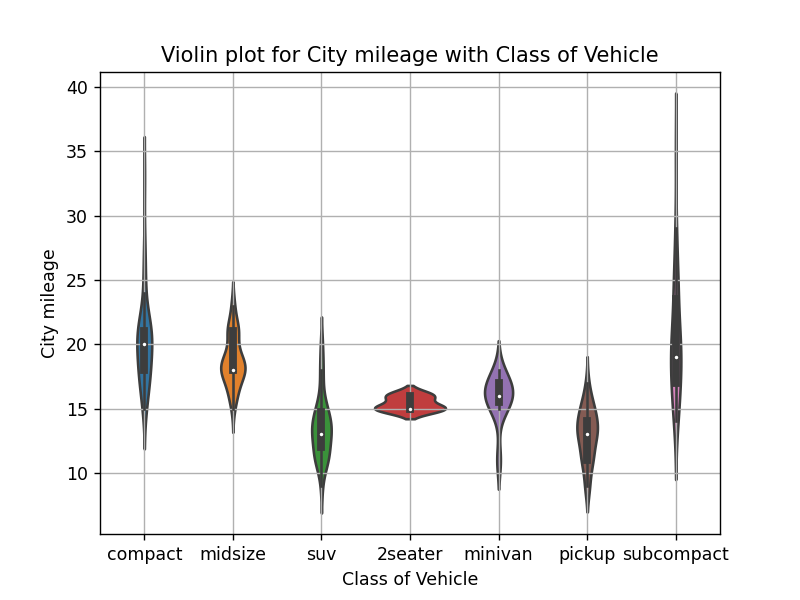
Similarly, we can use the same technique for violin plot:
%matplotlib notebook
import seaborn as sns
ax = sns.violinplot(x="class",y="cty",data=df)
ax.set(xlabel='Class of Vehicle',
       ylabel='City mileage',
       title='Violin plot for City mileage with Class of Vehicle')
ax.grid()
Key Points
Box plot