Support Vector Machine
Overview
Teaching: 20 min
Exercises: 0 minQuestions
How to use Support Vector Machine in Machine Learning model
Objectives
Learn how to use SVM in ML model
12 Support Vector Machine
The objective of the support vector machine (SVM) algorithm is to find a hyperplane in an N-dimensional space that distinctly classifies the data points.
12.1 Applications of Support Vector Machine:

12.2 Explanation
- To separate the two classes of data points, there are many possible hyperplanes that could be chosen
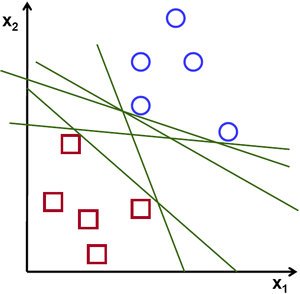
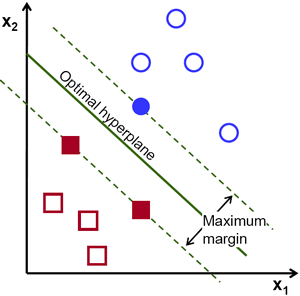
- SVM’s objective is to find a plane that has the maximum margin, i.e the maximum distance between data points of both classes. Maximizing the margin distance provides some reinforcement so that future data points can be classified with more confidence.
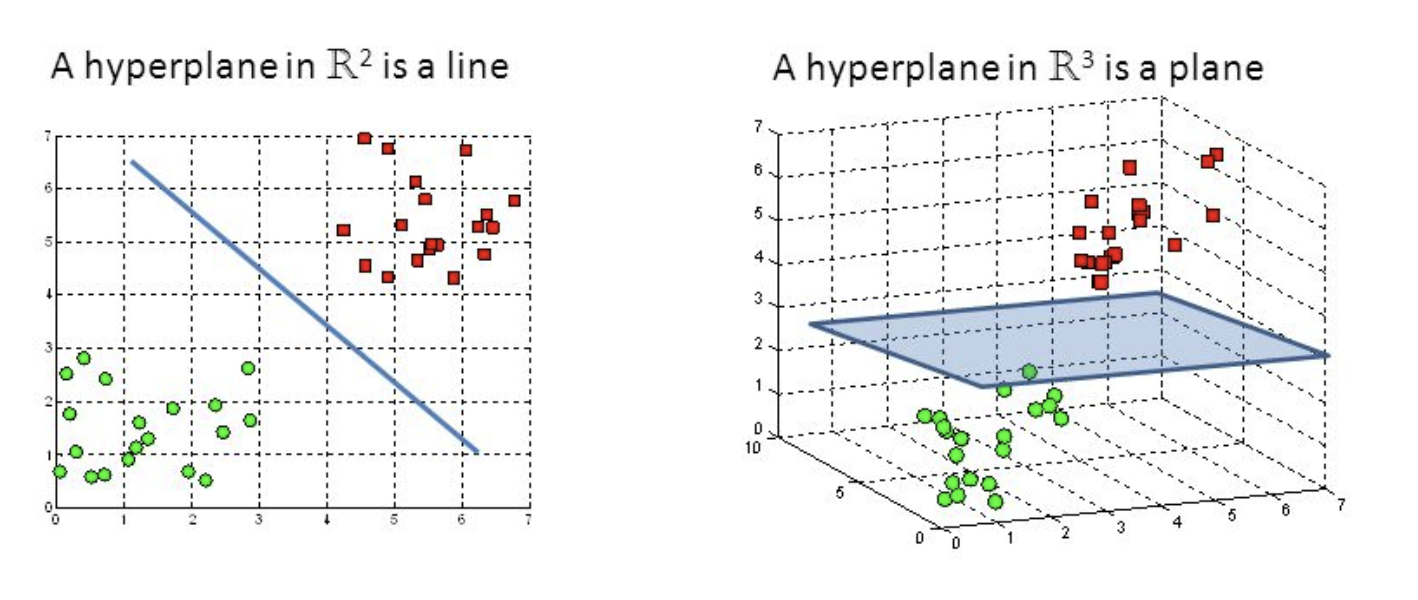
- Example of hyperplane in 2D and 3D position:
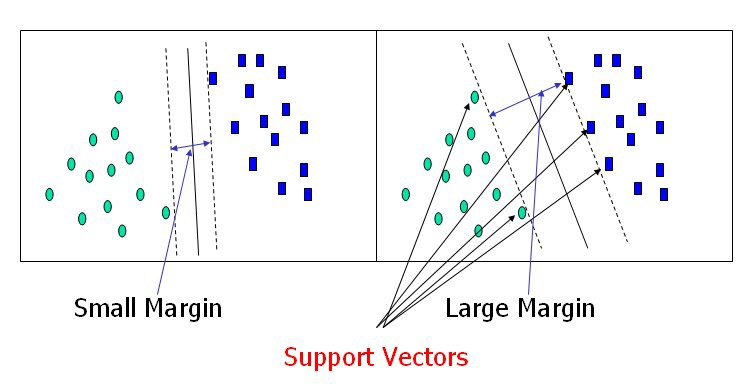
- Support vectors (SVs) are data points that are closer to the hyperplane and influence the position and orientation of the hyperplane. Using SVs to maximize the margin of the classifier. Removing SVs will change the position of the hyperplane. These are the points that help us build our SVM.
12.3 Implementation
- Using
caretpackage:
library(caret)
indT <- createDataPartition(y=iris$Species,p=0.6,list=FALSE)
training <- iris[indT,]
testing  <- iris[-indT,]

ModFit_SVM <- train(Species~.,training,method="svmLinear",preProc=c("center","scale"))
predict_SVM<- predict(ModFit_SVM,newdata=testing)
confusionMatrix(testing$Species,predict_SVM)
Note: there are other function in method = “svmPoly”, “svmRadial”, “svmRadialCost”, “svmRadialSigma”
- Using
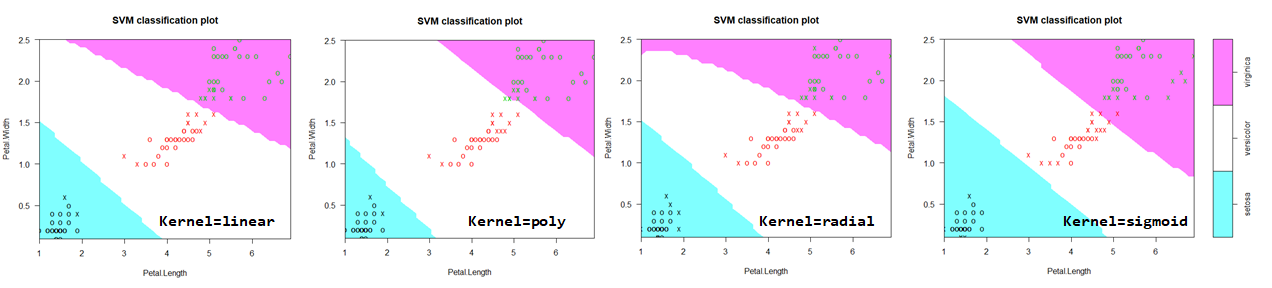
e1071package, we have better demonstration:
library(e1071)
Fit_SVM_ln <- svm(Species~Petal.Width+Petal.Length,
               data=training,kernel="sigmoid")
plot(Fit_SVM_ln,training[,3:5])

Fit_SVM_rbg <- svm(Species~Petal.Width+Petal.Length,
               data=training,kernel="radial",gamma=0.1)
plot(Fit_SVM_rbg,training[,3:5])

pred_rbg <- predict(Fit_SVM_ln,testing)
confusionMatrix(testing$Species,pred_rbg)
- Using different gamma parameter for kernal radial:
Fit_SVM_rbg <- svm(Species~Petal.Width+Petal.Length,
             data=training,kernel="radial",gamma=0.1)
plot(Fit_SVM_rbg,training[,3:5])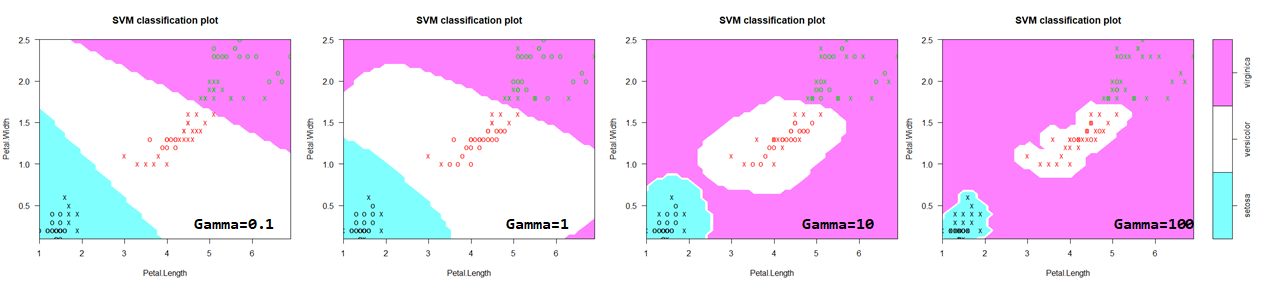
Key Points
SVM