Evaluation Metrics with Scikit-Learn
Overview
Teaching: 20 min
Exercises: 0 minQuestions
How do we measure the accuracy of ML model
Objectives
Learn different metrics with sklearn
4 Evaluation Metrics
- Evaluation Metric is an essential part in any Machine Learning project.
- It measures how good or bad is your Machine Learning model
- Different Evaluation Metrics are used for Regression model (Continuous output) or Classification model (Categorical output).
4.1 Regression model Evaluation Metrics
4.1.1 Correlation Coefficient (R) or Coefficient of Determination (R2):
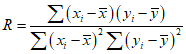
from sklearn import metrics
metrics.r2_score(y_test,y_pred)
4.1.2 Root Mean Square Error (RMSE) or Mean Square Error (MSE)
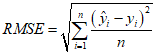
from sklearn import metrics
metrics.mean_squared_error(y_test,y_pred,squared=False) # RMSE
metrics.mean_squared_error(y_test,y_pred,squared=True) # MSE
4.2. Classification model Evaluation Metrics
4.2.1 Confusion Matrix
- A confusion matrix is a technique for summarizing the performance of a classification algorithm.
- You can learn more about Confusion Matrix here
For binary output (classification problem with only 2 output type, also most popular):

4.2.2 Accuracy
The most common metric for classification is accuracy, which is the fraction of samples predicted correctly as shown below:

from sklearn import metrics
metrics.accuracy_score(y_test,y_pred)
4.2.3 Precision
Precision is the fraction of predicted positives events that are actually positive as shown below:
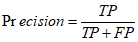
4.2.4 Recall
Recall (also known as sensitivity) is the fraction of positives events that you predicted correctly as shown below:

4.2.5 F1 score
The f1 score is the harmonic mean of recall and precision, with a higher score as a better model. The f1 score is calculated using the following formula:
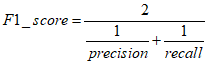
More information on Precision, Recall and F1 score can be found here
metrics.precision_recall_fscore_support(y_test,y_pred,average='binary')
4.2.6 AUC-ROC curve
- ROC: Receiver Operating Characteristics: probability curve
- AUC: Area Under The Curve: represents the degree or measure of separability.
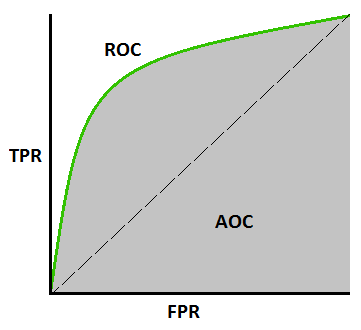
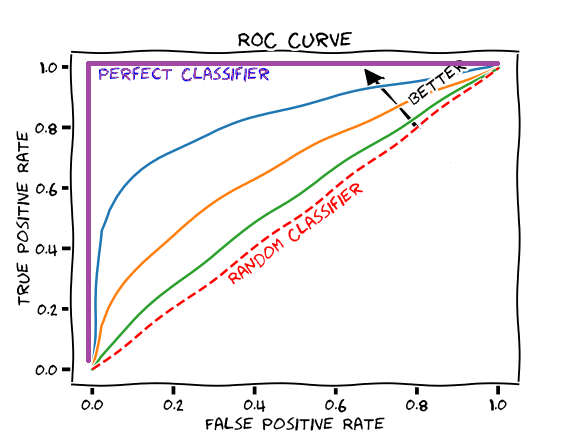
- AUC = 1: perfect prediction
- AUC = 0.8: model has 80% chance to predict the right class
- AUC = 0.5: worst case, model has NO accuracy in prediction (random)
- AUC = 0: the model is actually reciprocating the classes
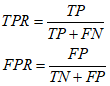
ROC Interpretation
Code to calculate FPR, TPR:
from sklearn.metrics import roc_curve
fpr, tpr, thresholds = roc_curve(y_test,y_pred)
Code to calculate AUC score:
from sklearn.metrics import roc_auc_score
auc_score = roc_auc_score(y_test,y_pred)
We will go into detail how to plot AUC-ROC curve in the next chapter with a classification problem
Key Points
sklearn, metrics