Unsupervised Learning
Overview
Teaching: 20 min
Exercises: 0 minQuestions
What is Unsupervised Learning in Machine Learning model
Objectives
Learn how to use K-mean clustering in ML model
14. Unsupervised Learning
- No labels are given to the learning algorithm leaving it on its own to find structure in its input.
- Unsupervised learning can be a goal in itself (discovering hidden patterns in data) or a means towards an end (feature learning).
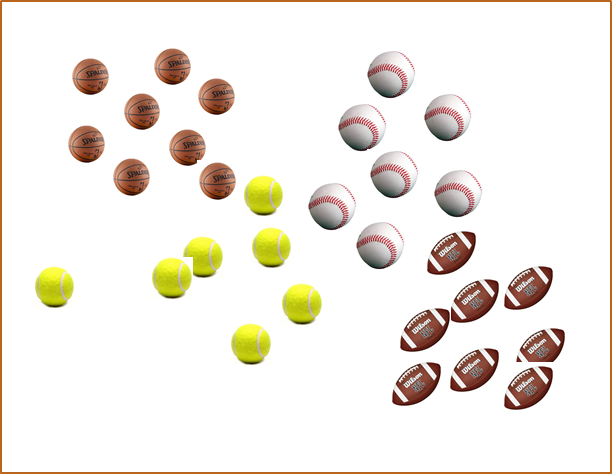
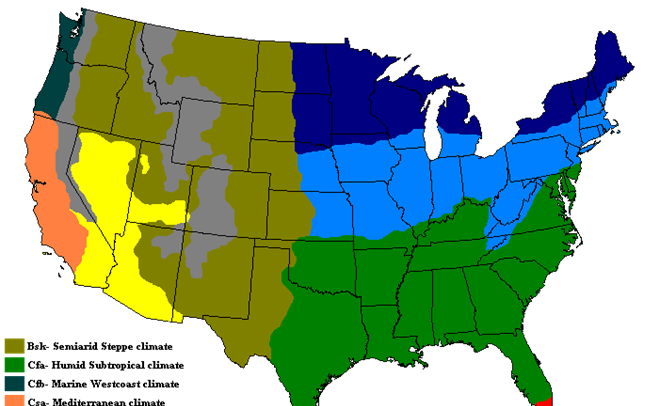
- Used when no feature output data
- Often used for clustering data
- Typical method:
K-means clustering
Hierarchical clustering
Ward clustering
Partition Around Median (PAM)
14.1. K-means clustering
14.1.1. Explanation of K-means clustering method:
- Given a set of data, we choose K=2 clusters to be splited:

- First select 2 random centroids (denoted as red and blue X)

- Compute the distance between 2 centroid red X and blue X with all the points (for instance using Euclidean distance) and compare with each other. 2 groups are created with shorter distance to 2 centroids

- Now recompute the new centroids of the 2 groups (using mean value of all points in the same groups):

- Compute the distance between 2 new centroids and all the points. We have 2 new groups:

- Repeat the last 2 steps until no more new centroids created. The model reach equilibrium:

14.1.2. Example with K=3


14.1.3. Implementation
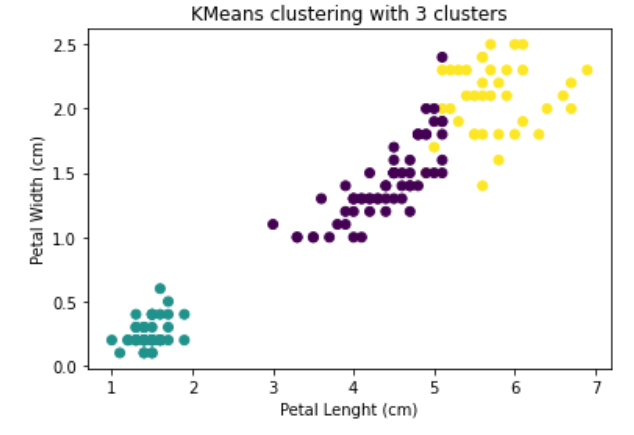
Here we use the iris data set with only predictors
from sklearn.datasets import load_iris
from sklearn.model_selection import train_test_split

import numpy as np
import pandas as pd
iris = load_iris()
X = iris.data
Apply Kmeans and plotting
from sklearn.cluster import KMeans
import matplotlib.pyplot as plt

model_KMeans = KMeans(n_clusters=3)
model_KMeans.fit(X)

plt.scatter(X[:,2],X[:,3],c=model_KMeans.labels_)
plt.xlabel(iris.feature_names[2])
plt.ylabel(iris.feature_names[3])
plt.title('KMeans clustering with 3 clusters')
plt.show()
14.1.4. How to find optimal K values:
14.1.4.1. Elbow approach
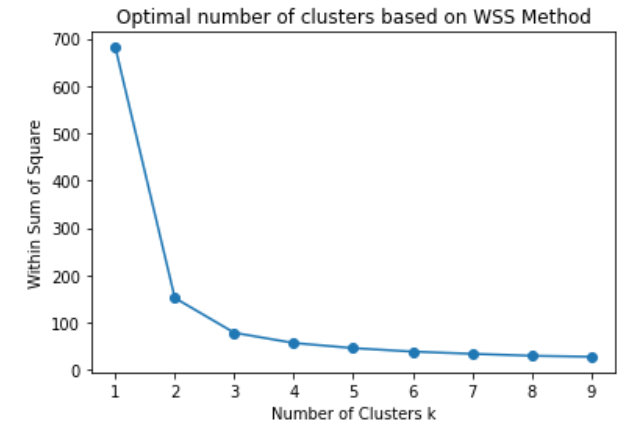
- Similar to KNN method for supervised learning, for K-means approach, we are able to use Elbow approach to find the optimal K values.
- The Elbow approach ues the Within-Cluster Sum of Square (WSS) to measure the compactness of the clusters:

The optimal K-values can be found from the Elbow using method=”wss”:
wss = []
for k in range(1,10):
    model = KMeans(n_clusters=k).fit(X)
    wss.append(model.inertia_)

plt.scatter(range(1,10),wss)
plt.plot(range(1,10),wss)
plt.xlabel("Number of Clusters k")
plt.ylabel("Within Sum of Square")
plt.title("Optimal number of clusters based on WSS Method")
plt.show()
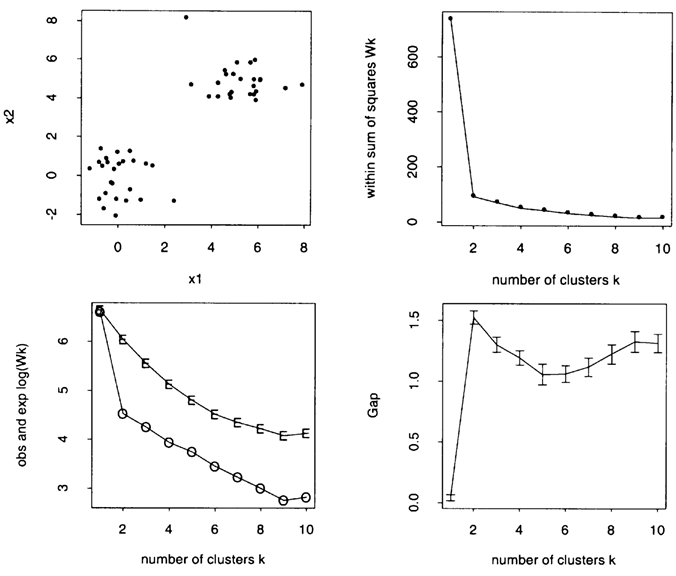
14.1.4.2. Gap-Statistics approach
- Developed by Prof. Tibshirani et al in Stanford
- Applied to any clustering method (K-means, Hierarchical)
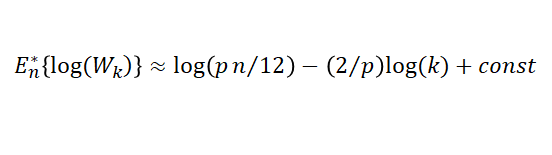
- Maximize the Gap function:
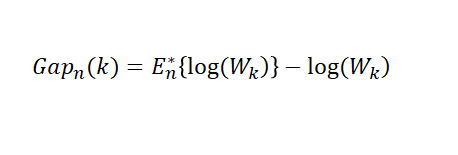
E*n: expectation under a sample size of n from the reference distribution
Installation:
This version of Gap Statistics is not official. Until the moment of writing this documentation, no official Gap Statistics has been released in Python. We use the version from milesgranger’s github
pip install git+git://github.com/milesgranger/gap_statistic.git
pip install gapstat-rs
Implement Gap-Statistics:
from gap_statistic import OptimalK

optimalK = OptimalK(n_jobs=1) # No parallel
n_clusters = optimalK(X[:,1:4], cluster_array=np.arange(1, 15))
print('Optimal clusters: ', n_clusters)
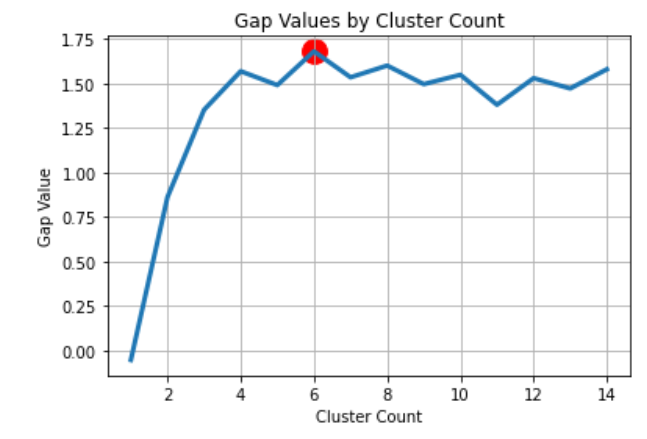
Plot Gap-Statistics:
import matplotlib.pyplot as plt
plt.plot(optimalK.gap_df.n_clusters, optimalK.gap_df.gap_value, linewidth=3)
plt.scatter(optimalK.gap_df[optimalK.gap_df.n_clusters == n_clusters].n_clusters,
            optimalK.gap_df[optimalK.gap_df.n_clusters == n_clusters].gap_value, s=250, c='r')
plt.grid(True)
plt.xlabel('Cluster Count')
plt.ylabel('Gap Value')
plt.title('Gap Values by Cluster Count')
plt.show()
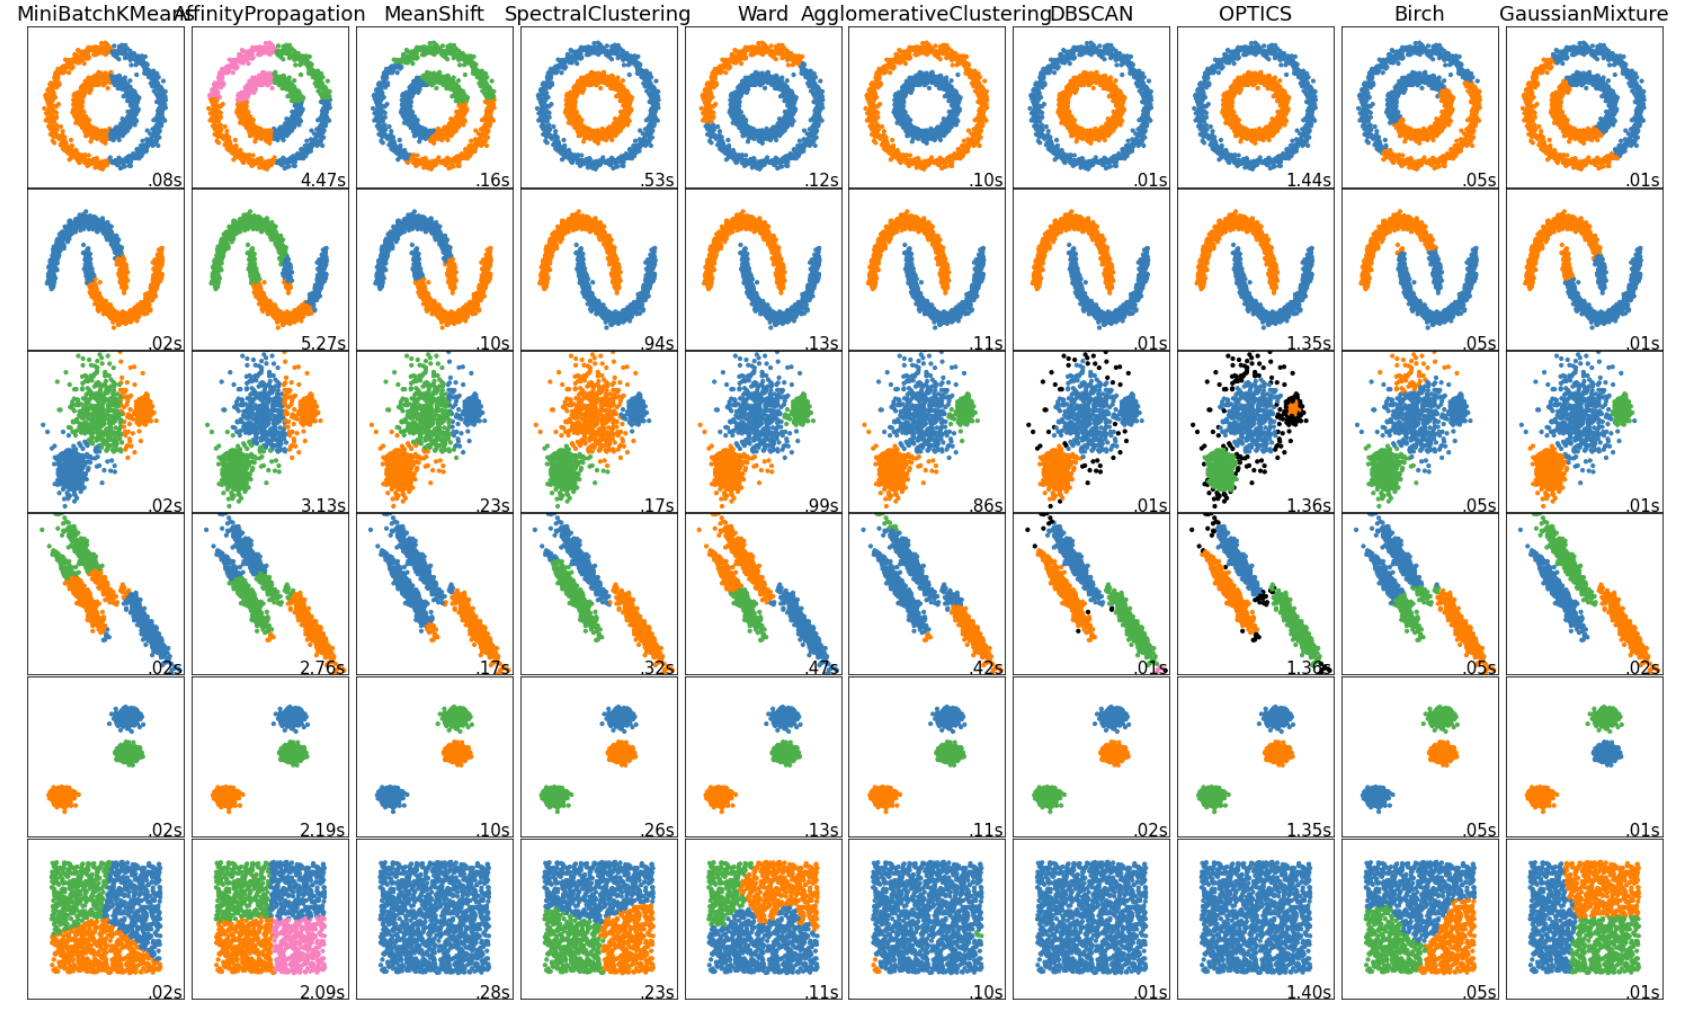
14.2. Comparison between different clustering methods in sklearn:
Key Points
K-mean